
In semiconductor and display manufacturing, film thickness uniformity is one of the numbers engineers look at first. But before you compare two uniformity figures side by side, check whether they even describe the same thing.
Two numbers, two definitions
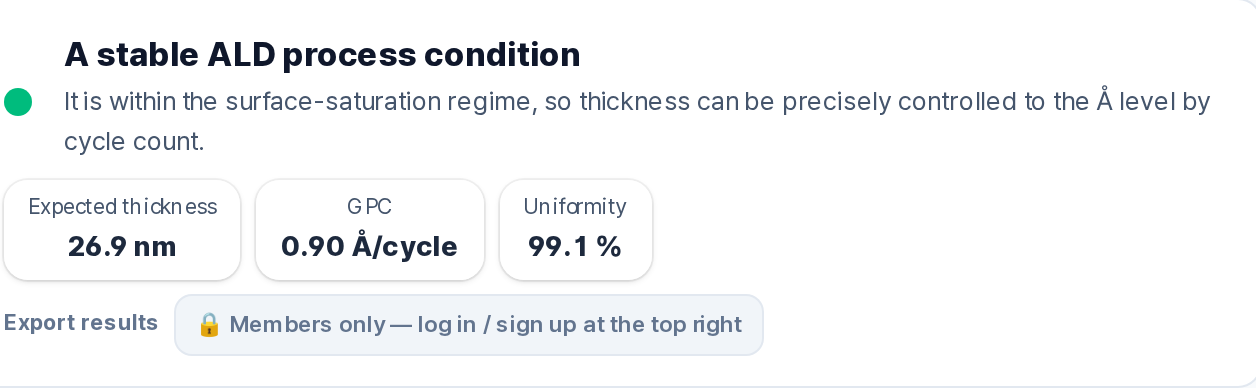
Semi Process Lab displays a uniformity value calculated as 100% minus the non-uniformity estimated by the model. This is not a statistic derived from the wafer map.
The wafer map shows a separate percentage: (max − min) / mean. That is a range-based metric, not a 1σ figure. The mean itself is a simple average of radial sample points, not area-weighted.
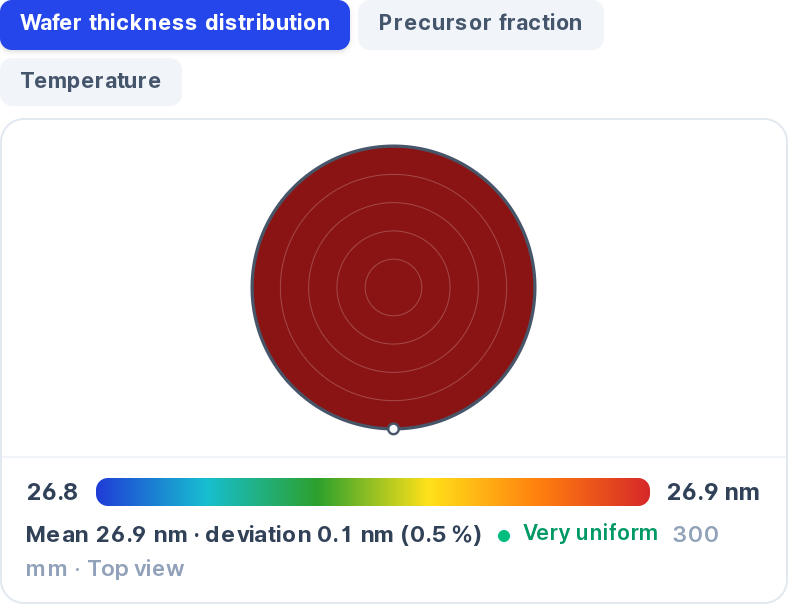
So "deviation 0.1 nm (0.5%)" and "Uniformity 99.1%" sit on the same screen, but they come from different calculations applied to different representations of the process. Comparing them directly tells you nothing.
The literature does not settle the question either. Some ALD studies define non-uniformity as (max − min) / (2 × mean) × 100%, halving the range-based figure. Without knowing which definition a number follows, you cannot place it next to another.
What to check before you compare
Before placing two uniformity numbers next to each other, verify:
- Definition. Range-based, 1σ-based, or something else?
- Sample locations. Radial points, full-wafer grid, or edge-excluded?
- Averaging method. Simple mean or area-weighted mean?
- Source. Measured from a physical wafer or estimated by a model?
A number that looks better may simply follow a more forgiving formula.
Sensitivity is not cause
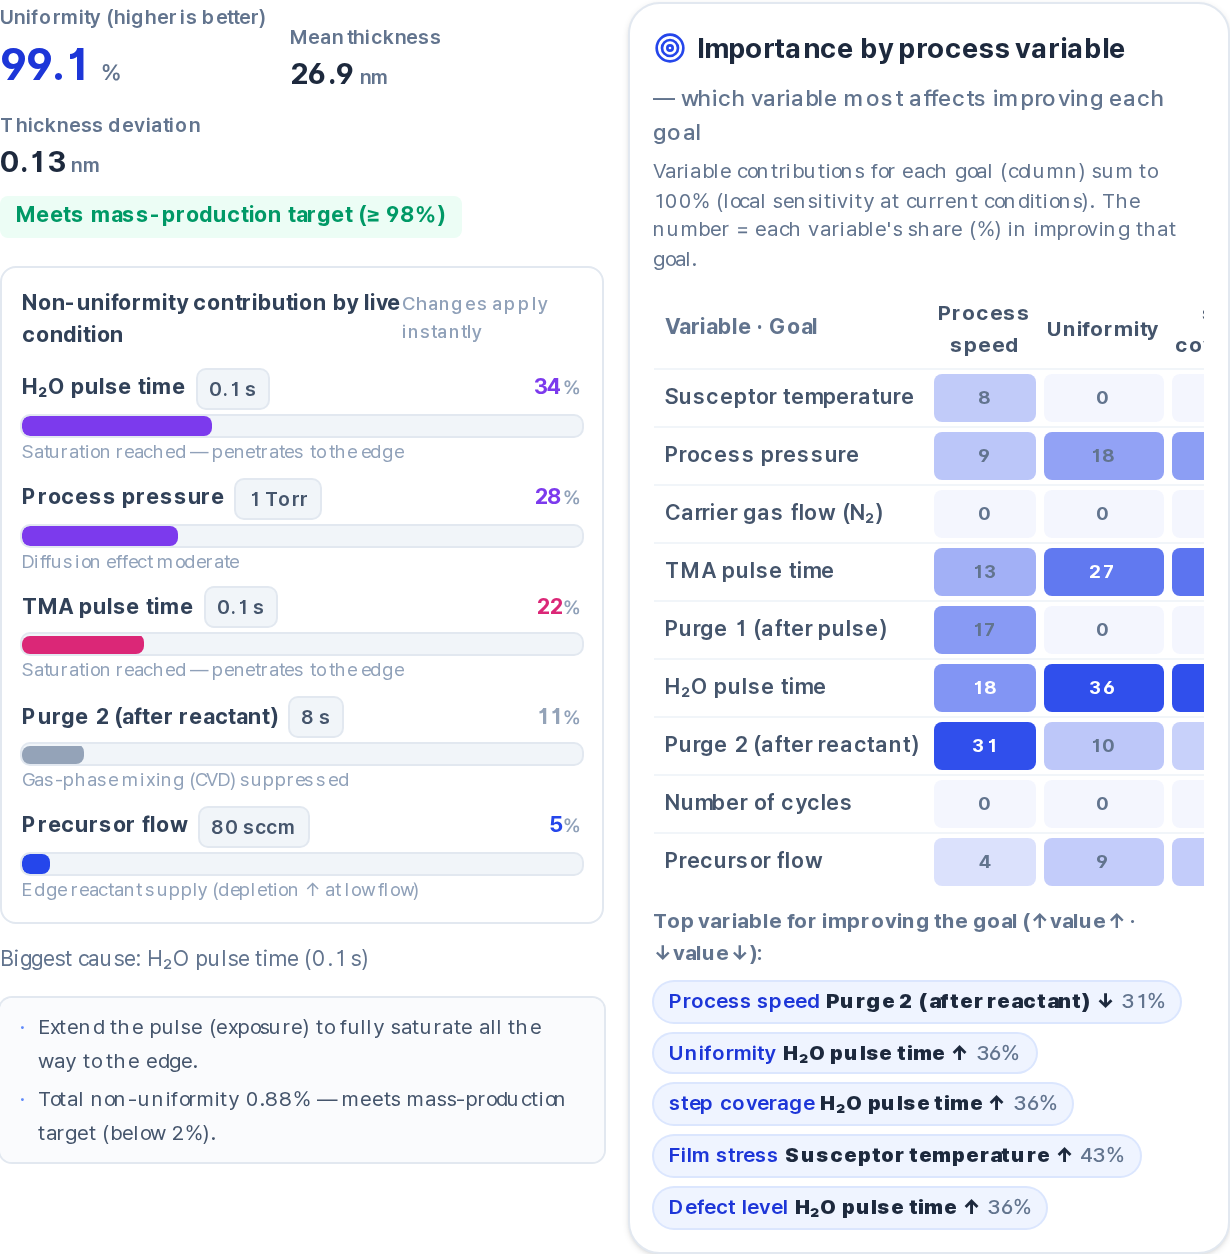
The "variable importance" card perturbs each variable by ±8% of its allowed range, applies a 0.6 power transform, and normalizes the results to sum to 100% per target. The "non-uniformity contribution" card uses a different method: it perturbs by ±10%, takes the absolute output difference, and normalizes. The two cards do not share a formula. Only registered variables appear in either. Neither is a causal decomposition of the process.
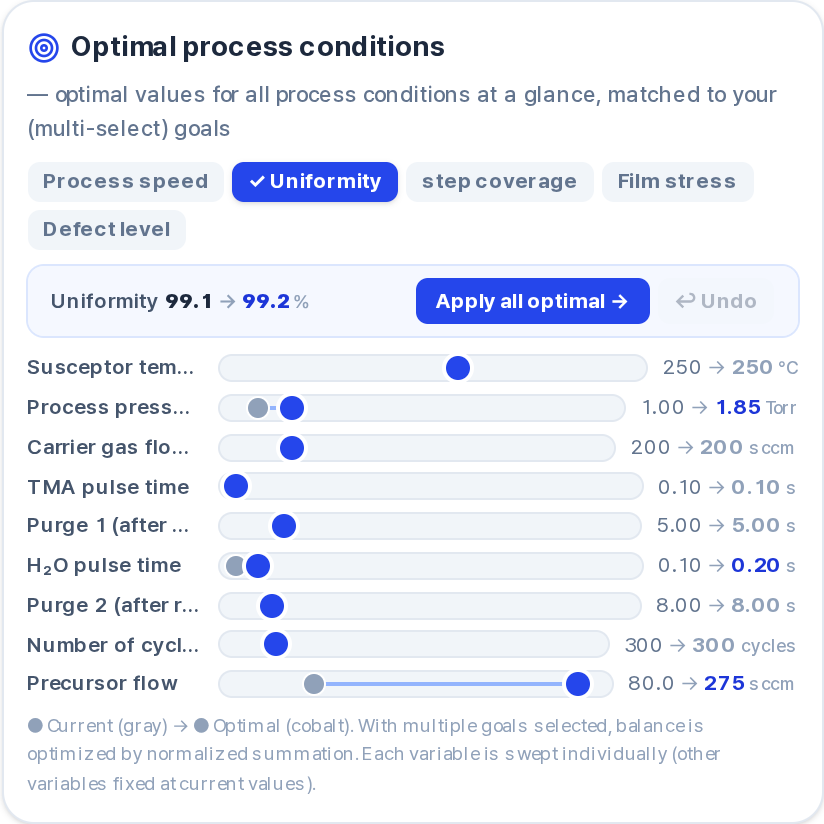
The "optimal process conditions" feature sweeps candidates for each variable while holding others fixed, then combines the picks. There is no guarantee the combined set outperforms the original. A display shift from 99.1% to 99.2% is what the screen shows under those conditions — not a validated improvement.
FAQ
Is 99.1% a measured uniformity? No. It is 100% minus the model-estimated non-uniformity. We have not measured wafer uniformity directly.
Can I compare the uniformity figure to the wafer map percentage? No. They use different formulas and different data sources. The map uses (max − min) / mean; the uniformity value uses a model estimate.
Does variable importance tell me what causes non-uniformity? It tells you which registered variables the model output is sensitive to within the tested perturbation range. Sensitivity is not the same as cause.
Are the suggested optimal conditions verified? They are assembled by sweeping each variable independently. The combined set has not been validated against physical measurement.